How to fix ElasticSearch client exception “A binding to org.elasticsearch.shield.transport was already configured at _unknown_. at _unknown_”

This ticket explains a possible solution  for the “A binding to org.elasticsearch.shield.transport was already configured at _unknown_. at _unknown_” exception when a Java ElasticSearch client tries to connect to a (ElasticSearch) cluster using Shield.

Environment

ElasticSearch version: 1.7.3

Shield version: 1.3.3

Context

The way to connect a Java ElasticSearch client to a cluster using Shield is quite straightforward; you can see the ElasticSearch documentation. The most important part (at least in the context of this problem) is the creation of the Settings instance:

Settings settings = ImmutableSettings.settingsBuilder()
                .put("cluster.name", clusterName)
                .put("shield.ssl.keystore.path", jksPath)
                .put("shield.ssl.keystore.password", jksPassword)
                .put("shield.transport.ssl", "true")
                .put("plugin.types", "org.elasticsearch.shield.ShieldPlugin")
                .build();
......

When the client is executed, the following strange stacktrace is thrown:

Full stacktrace

1) A binding to org.elasticsearch.shield.transport.filter.IPFilter was already configured at _unknown_.
  at _unknown_
2) A binding to org.elasticsearch.shield.transport.ClientTransportFilter was already configured at _unknown_.
  at _unknown_
3) A binding to org.elasticsearch.shield.ssl.ClientSSLService was already configured at _unknown_.
  at _unknown_
4) A binding to org.elasticsearch.shield.ssl.ServerSSLService was already configured at _unknown_.
  at _unknown_
4 errors
       at org.elasticsearch.common.inject.internal.Errors.throwCreationExceptionIfErrorsExist(Errors.java:344)
       at org.elasticsearch.common.inject.InjectorBuilder.initializeStatically(InjectorBuilder.java:151)
       at org.elasticsearch.common.inject.InjectorBuilder.build(InjectorBuilder.java:102)
       at org.elasticsearch.common.inject.Guice.createInjector(Guice.java:93)
       at org.elasticsearch.common.inject.Guice.createInjector(Guice.java:70)
       at org.elasticsearch.common.inject.ModulesBuilder.createInjector(ModulesBuilder.java:59)
       at org.elasticsearch.client.transport.TransportClient.<init>(TransportClient.java:195)
       at org.elasticsearch.client.transport.TransportClient.<init>(TransportClient.java:125)


Root cause

The root cause of this problem is the line:

.put("plugin.types", "org.elasticsearch.shield.ShieldPlugin")

If this line is removed then the problem is solved. This property should be exclusively used with the 2.0 version of Shield and not with  1.3.3 version.

The moral of this story ? First of all you should use the right version of the ElaticSearch documentation (in my case I was running the 1.7.3  version but I used the documentation for the 2.o). The second point is  that ElasticSearch API is not very user friendly (I even dare to say that is badly designed). I would preferred that ImmutableSettings.Builder class to have a put method with a Java enum as first parameter not a Java String.

AppDynamics Pro – basics

The goal of this ticket is to present and explain the basic notions of the AppDynamics Pro product.

  • Node – a node is the basic unit of processing that AppDynamics monitors. A node is instrumented by an AppDynamics agent.
  • Tier – a tier represents an instrumented service or multiple services that perform the exact same functionality. It represents a more logical view of the application.A tier is composed of one or multiple nodes.
  • Application – multiple tiers gathered together.
  • Business Transaction – represents a distinct logical user activity. The entire application traffic is organized in Business Transactions.
  • Transaction Snapshot -set of diagnostic data, taken at a certain point in time, for a specific Business Transaction across all the tiers though which the transaction has passed. The Transaction Snapshots are triggered periodically (every 10 minutes) or automatically for the slow and error business transactions.
  • Metrics -application performance informations sent from the App Server Agents and Machine Agents to the controller.
  • Baselines – set of metrics within a time range.
  • Baseline Deviations – degree of deviation from baseline at any given point in time and by default are calculated by a number of standard deviations above the average.
  • Service Endpoint – performance metrics focused on a particular service or set of services independent of business transactions.
  • Health Rule – defines a condition or set of conditions in terms of metrics. The condition compares the performance metrics that AppDynamics collects with some static or dynamic threshold that you define. If performance exceeds the threshold, a health rule violation event is triggered. There are two types of thresholds: Warning and Critical.
  • Diagnostic Session – the goal is to collect extra Transaction Snapshots for one or more Business Transactions for a period of time.
  • Events – emitted when the application state change. Eight type of events:
    • Health rules violation
    • Too many slow transactions
    • Too many errors
    • Code problems
    • Application changes
    • JVM and CLR (.NET) Crashes
    • AppDynamics Config Warnings
    • Discovery (new application, tier or done discovered)
  • Errors – AppDynamics treat as errors the following events:
    • unhandled exceptions
    • HTTP error codes from 400 to 505 (the error codes to catch are configurable)
    • Error or Fatal logging events (Log4j or java.util.logging)
  • Information Points – collects metrics outside the context of Business Transactions and across several Business Transactions. For me it looks similar with the Service Endpoints.
  • Data Collectors – collects extra-information at the Business Transaction level like application code arguments, return values, and variables and displays the information in the Call Drill Down panels. There are two types of Data Collectors : method invocation date collectors and HTTP data collectors.

How to run Cisco ASDM as a Java Web Start application

Problem

My goal was to use Cisco ASDM on a Ubuntu system; for the Linux systems Cisco offers a Java version of the ASDM application. The application can be executed as a Java Web Start application meaning that basically you need only a browser and a JRE (Java Runtime Environment) to execute the application.

The working workflow should be the following one:

  1. go to the Cisco web console (in my case the url was https:/192.168.1.1/admin).
  2. retrieve the jnlp (Java Network Launch Protocol ) file (in my case the file name was asdm.jnlp)
  3. execute jnlp file to start the ASDM application.

In my case, while executing the step 1 from the previous workflow I had the following error:

ciscoAsdmError

I was pretty sure that the JRE is correctly installed but because of some obscure reason the browser do not recognize that the JRE is present.

Solution

After trying different solutions like importing the Cisco Web Server certificate to the JRE keystore, mark the Cisco Web Server url as a trusted url for the browser and for the JRE, I found a way to solve the problem (retrieve the jnlp file).

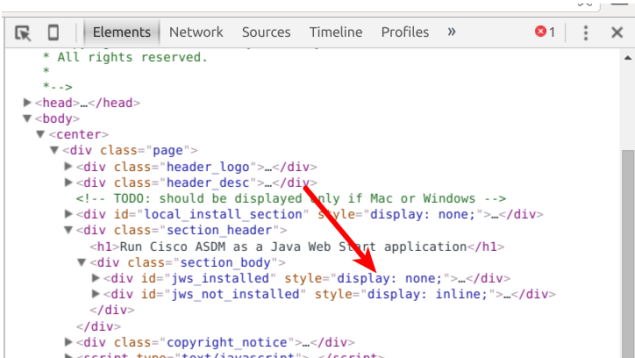
So, looking to the HTML code of the index.html page you can see 2 divs with self-explanatory ids (“jws_installed” and “jws_not_installed”). The visibility of this divs is handled by the display attribute (display:none will not show the div, display:inline will show the div). As you can see on the original page the div that should be shown if the jws is installed is not shown (see the red arrow on the following image).

ciscoAsdmHtml

So, by modifying the display attribute of the “jws_installed” div, it would be possible to render the page as if the browser recognized that JRE is installed on the system. And here is the result:

CiscoAsdmOk

Now, you can click on the “Run ADSM” button, so the jnlp file can be downloaded on your system. Once you have the jnlp file, then you can execute it using the following command:

javaws ./asdm.jnlp

(My) BruCON 2015 notes (5)

Here are my quick notes from the BruCON 2015 conference. All the slides can be found here.

This is the last ticket about the BruCOn 2015 so, it contains the presentations for which my notes are not so good 🙂

Creating REAL Threat Intelligence with EvernotebruCon

goal:

  • experiment to generate threat intelligence with Evernote.
  • use Evernote as intelligence repository.

background:

  • before buying new commercial solution
    • try quick and dirty solution in house
    • invest in people &process first, then Products.

Use Evernote as a GTD(Getting Things Done ??)-Based Task Mgmt System.

  • treat  Evernote like  a  Database
    • Notebook  ==  Table
    • Note  ==  Free  Form  Record
    • Nested  Notebooks
    • Hierarchical  Tags

Looking Forward – Finding the right balance for INFOSEC

Some words about the infosec in the past and today:

  • in 1999 the security community was a small community
  • things start to change now BUT
    the ratios security/it people it’s very low

Some words about the security breaches:

  • 99% of the breaches is are due to basic things; BUT the companies are focusing on much complicated
    attacks but are forgetting the easy to fill gaps.
  • end-users are still the weakest link; for fishing only one click it’s enough to get in inside the it infrastructure
  • profiling is difficult BUT targeting the user is muck more easier.

Some words about the security industry:

  • security industry is too technology centric.
  • we just hope that the technology will solve the problems magically.
  • technology it takes over talent.

Some ideas for the defence:

  • Disabling local administrator accounts, or randomizing.
  • Rotating domain admin account passwords.
  • Disallow PowerShell execution for normal users.
  • Disallowing executables to be run through TEMP and other directories.
  • Network segmentation of user workstations.
  • Focus on detection capabilities over anything.

I am the Cavalry

The Cavalry is a organization that is focused on issues where computer security intersect public safety and human life. The areas of focus for The Cavalry are medical devices, automobiles, home electronics and public infrastructure.

How to influence people (a pen test like approach):

  • recon
  • empathizing (replaces finding vulnerabilities)
  • enabling changes (replaces exploitation)

Recon

known the official structure and the non-official one.

unofficial structure

  • who is liked
  • trusted influencers

Empathizing

  • understand the stakeholders
  • studies can give you a hint about the way of thinking
  • motivation, career ambitions
  • how the stakeholders make decisions
  • learn how to speak the stakeholders language – cross domain issues

Enabling changes

  • work the system;
  • be adaptive if it didn’t worked
  • riding waves, news
  • speak their language

(My) BruCON 2015 notes (4)

Here are my quick notes from the BruCON 2015 conference. All the slides can be found here.

The malware is just code so, as any other code it is possible (in theory) to analyze/reverse engineer it manually.

The triage is one of the functions of the incident response program and must answer the following three questions regarded to a specific input:

  • is the input malicious ?
  • if yes, what is exploiting ?
  • are we exposed ?

Triage is not malware analysis and should be quick and efficient. The triage workflow:

  • passive analysis.
  • first interaction and download.
    • some malware are crafted to be able to interact with the initial URL only limited number of times
    • some malware could profile your browser, check the browser version, platform, or use the user agent script to decide if the exploit can be executed or not.
    • some tools:useragentstring.com (to check your user agent), onlinecurl.com (on-line version of curl, copy paste a url and you get back the response), hurl.it (idem as previous one).
  • web component analysis.
    • once you have the web component (which is typically an html page + JavaScript) you could try to analyze it.
    • use jsBeautify.org to try to have something human readable in case the code is obfuscated.
    • try to use the browser debugger, eventually change JavaScript eval expressions.
  • exploit analysis.
    • can use showmycode.com to understand the exploit; it is capable to decompile Java, Flash, .Net, PHP
    • sometimes you can blindly search the metasploit exploit template library
  • payload extraction.
  • payload analysis.
    • can submit the file/s to VirusTotal or malwr (virtualized Cuckoo instances).
    • malwr can give you infos about the registry keys created, network traffic.
  • build IOCs (Indication Of Compromise).
    • collection of indicators which can be used to describe a compromised system.

This was an workshop, so the participants had to play with some of the tools. Here is the quick workflow that i followed:

start from a url -> use the onlinecurl.com to get the response (initial interaction) -> saved the response on a file and used to browser debugger to understand what the component is doing (web component analysis)-> get from the JavaScript another url that contains a link to a Java .class file -> use it showmycode.com to decompile the class file (exploit analysis)-> write some Java code to decode parts of the exploit and execute it on ideone.com (payload extraction)-> …time over :(.